Without local data, history and alerts, decisions about safety, production, travel and fire prevention become reactive. NimbusIQ turns local environmental measurements into continuous operational information.
Platform
The whole environment, at a glance
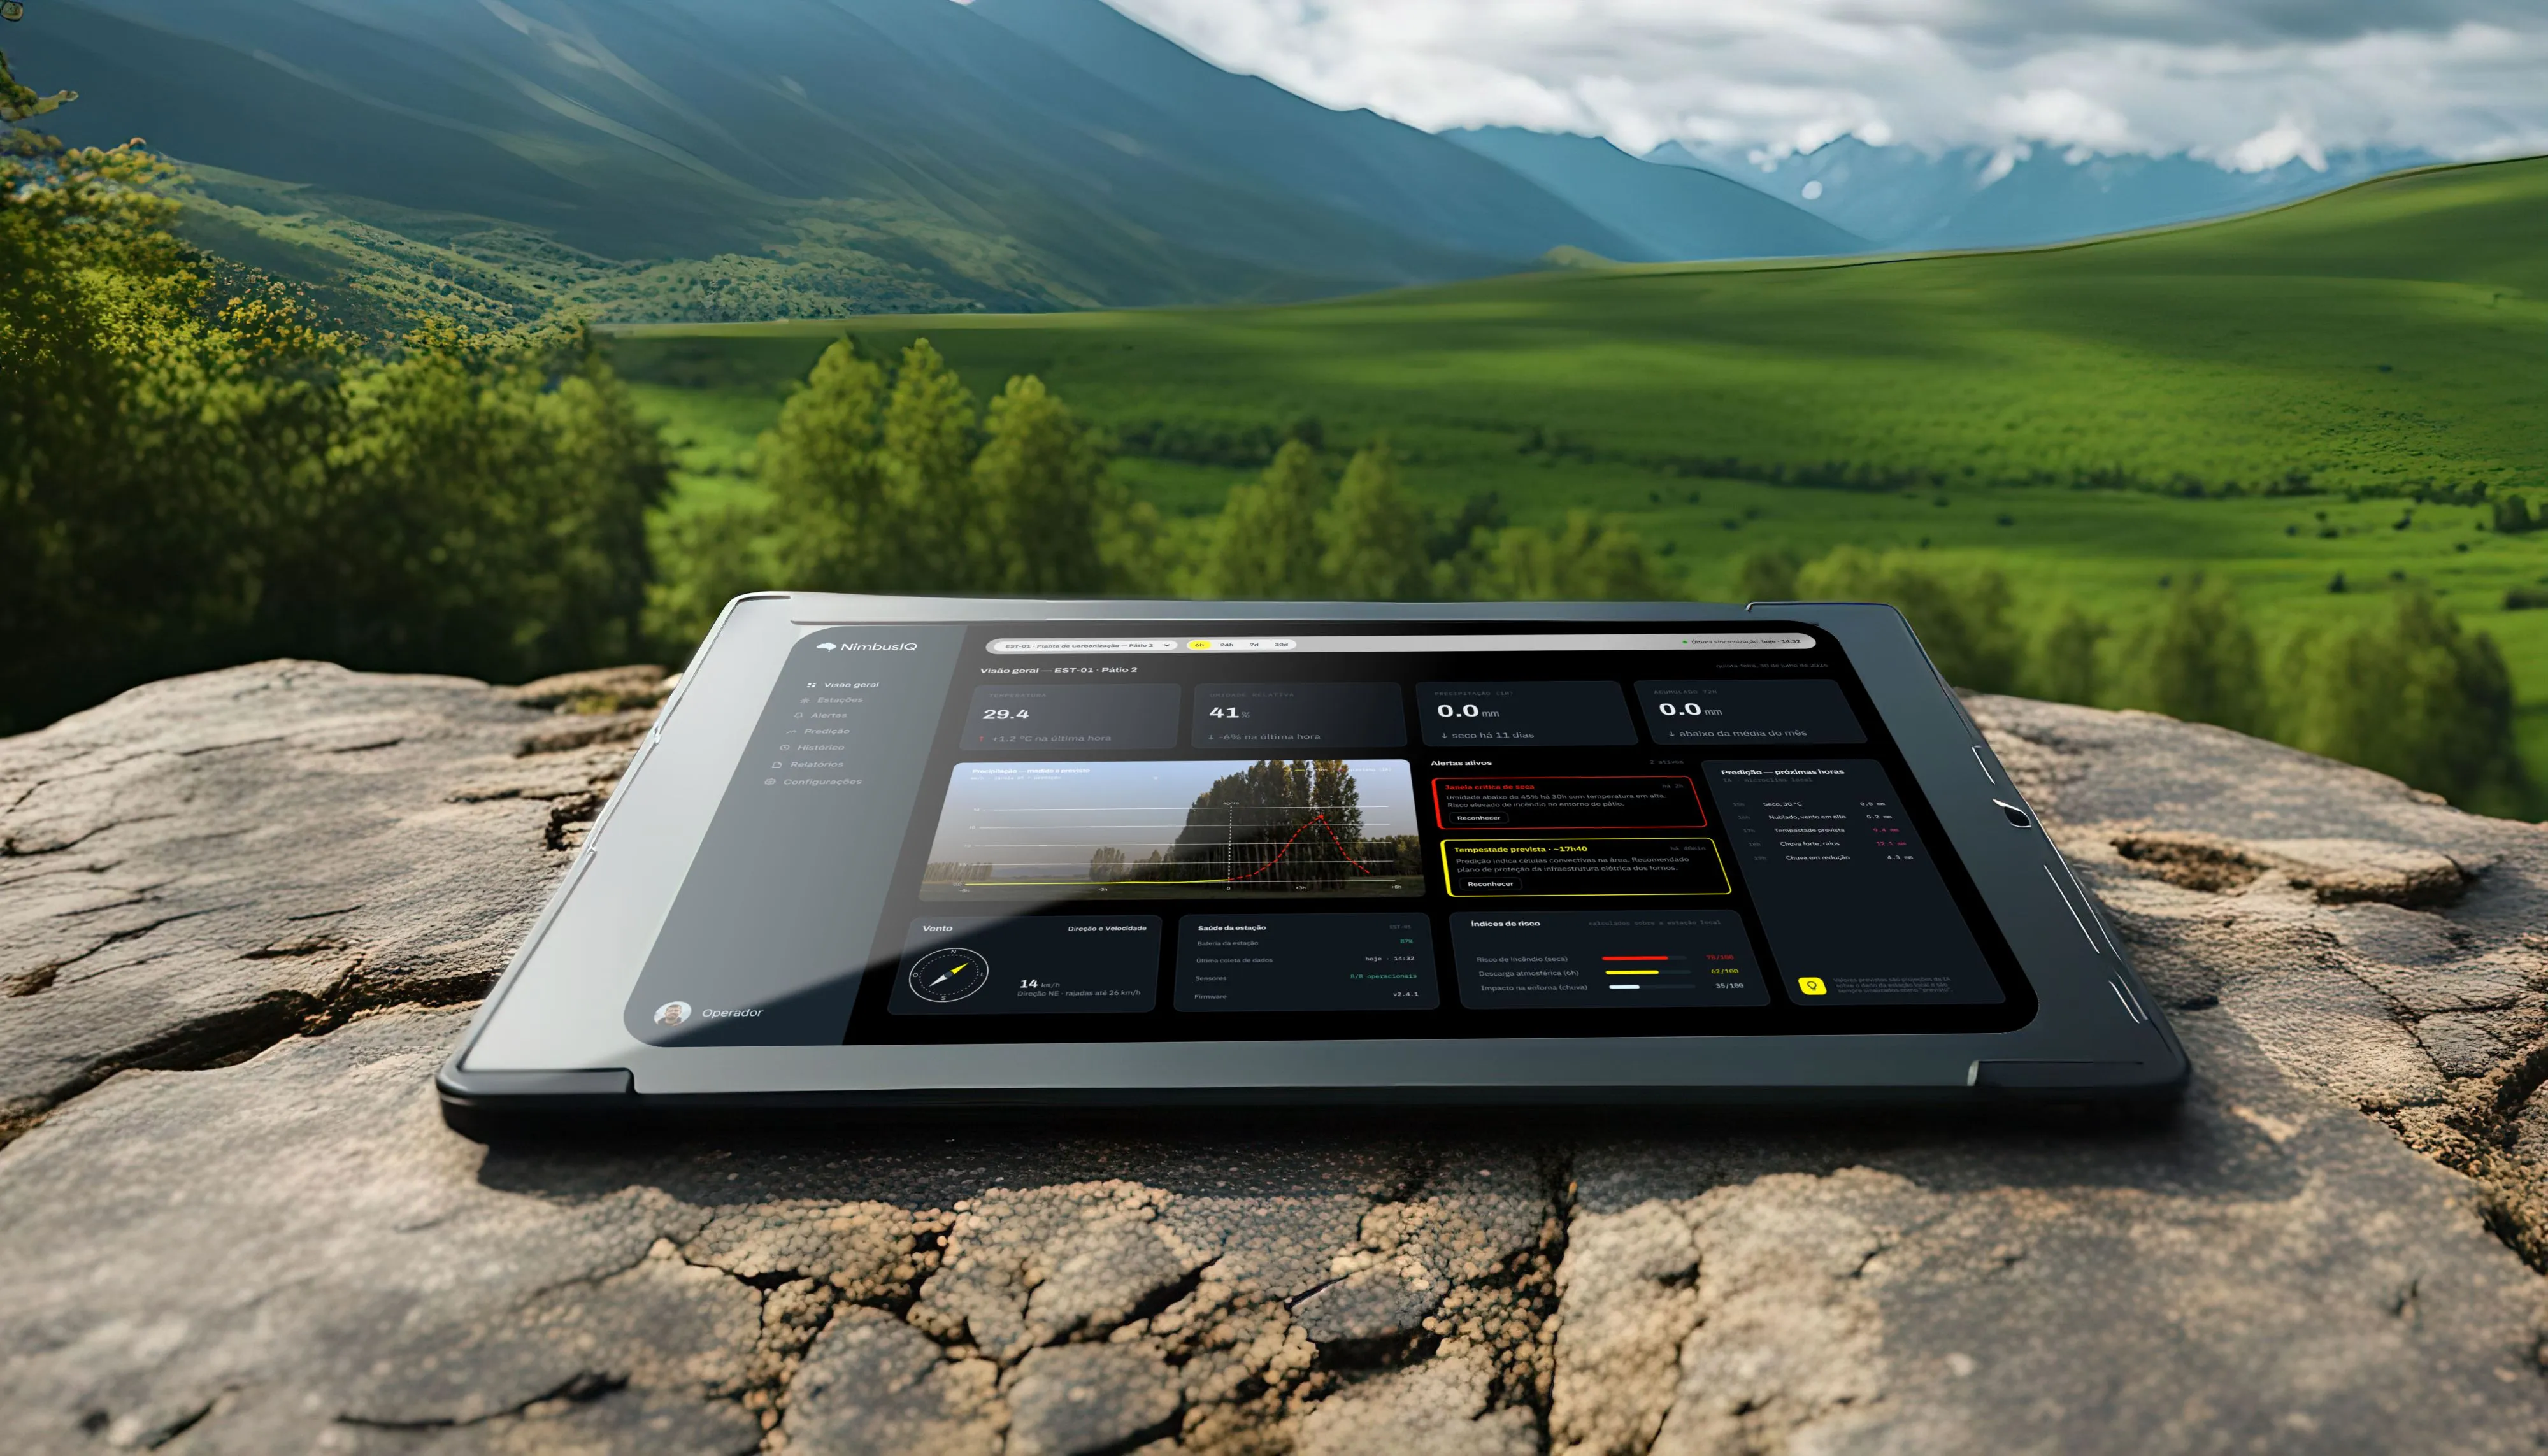
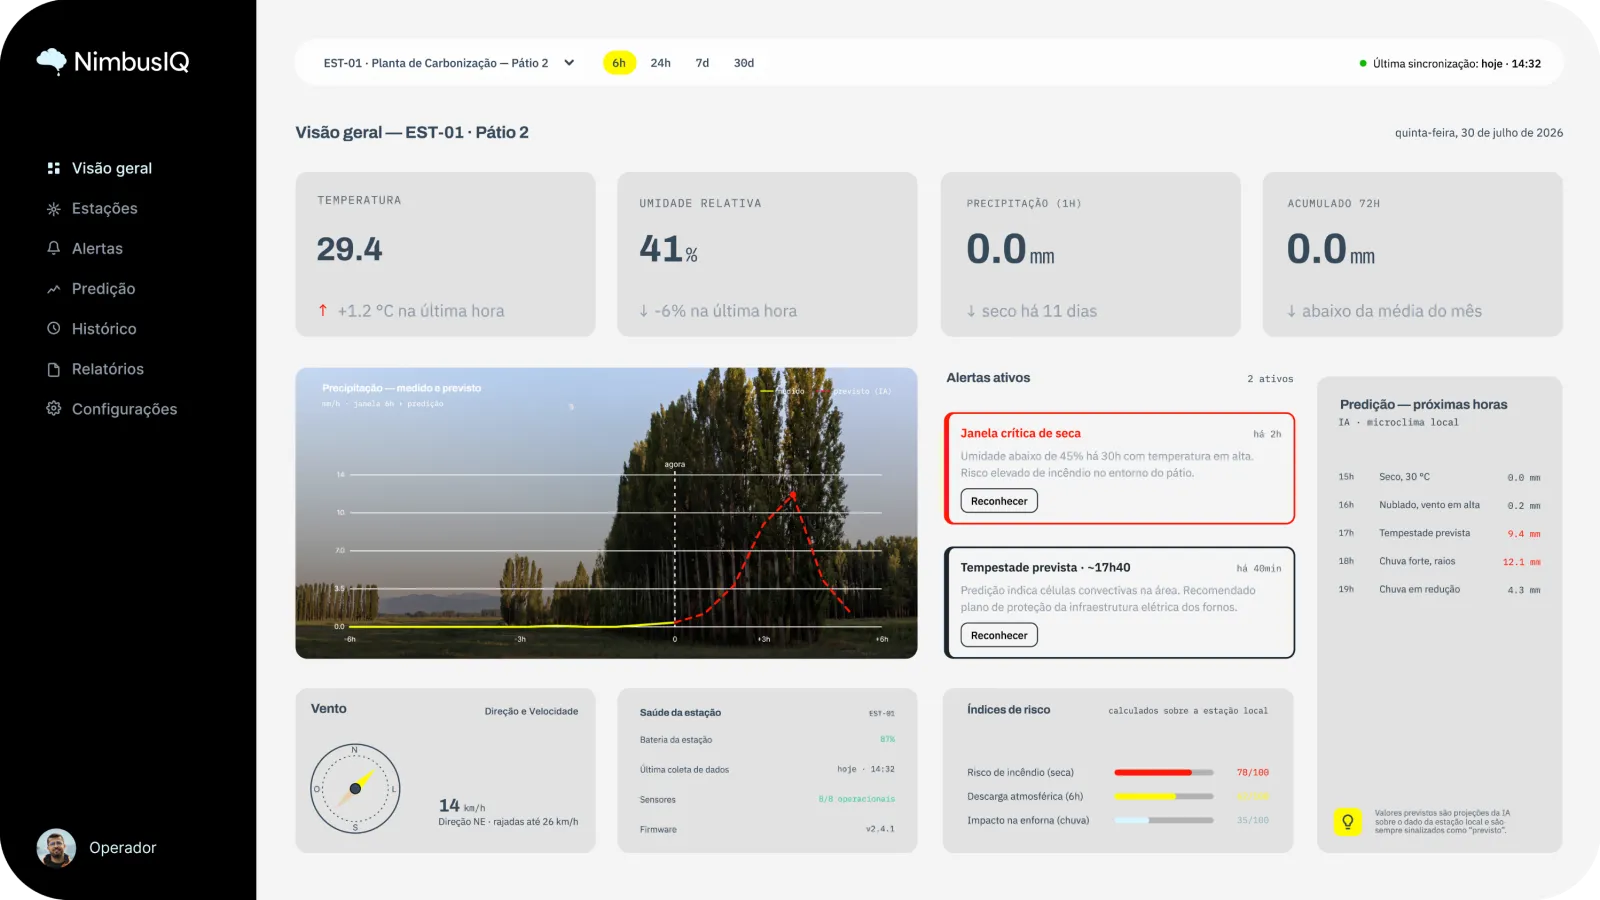
Dashboards, maps, history and indicators in one place. You see what the station is measuring right now, what changed over the last few hours, and how it compares with other periods and areas.
Dashboards
History
Indicators
Measurement
The sensor at the exact point
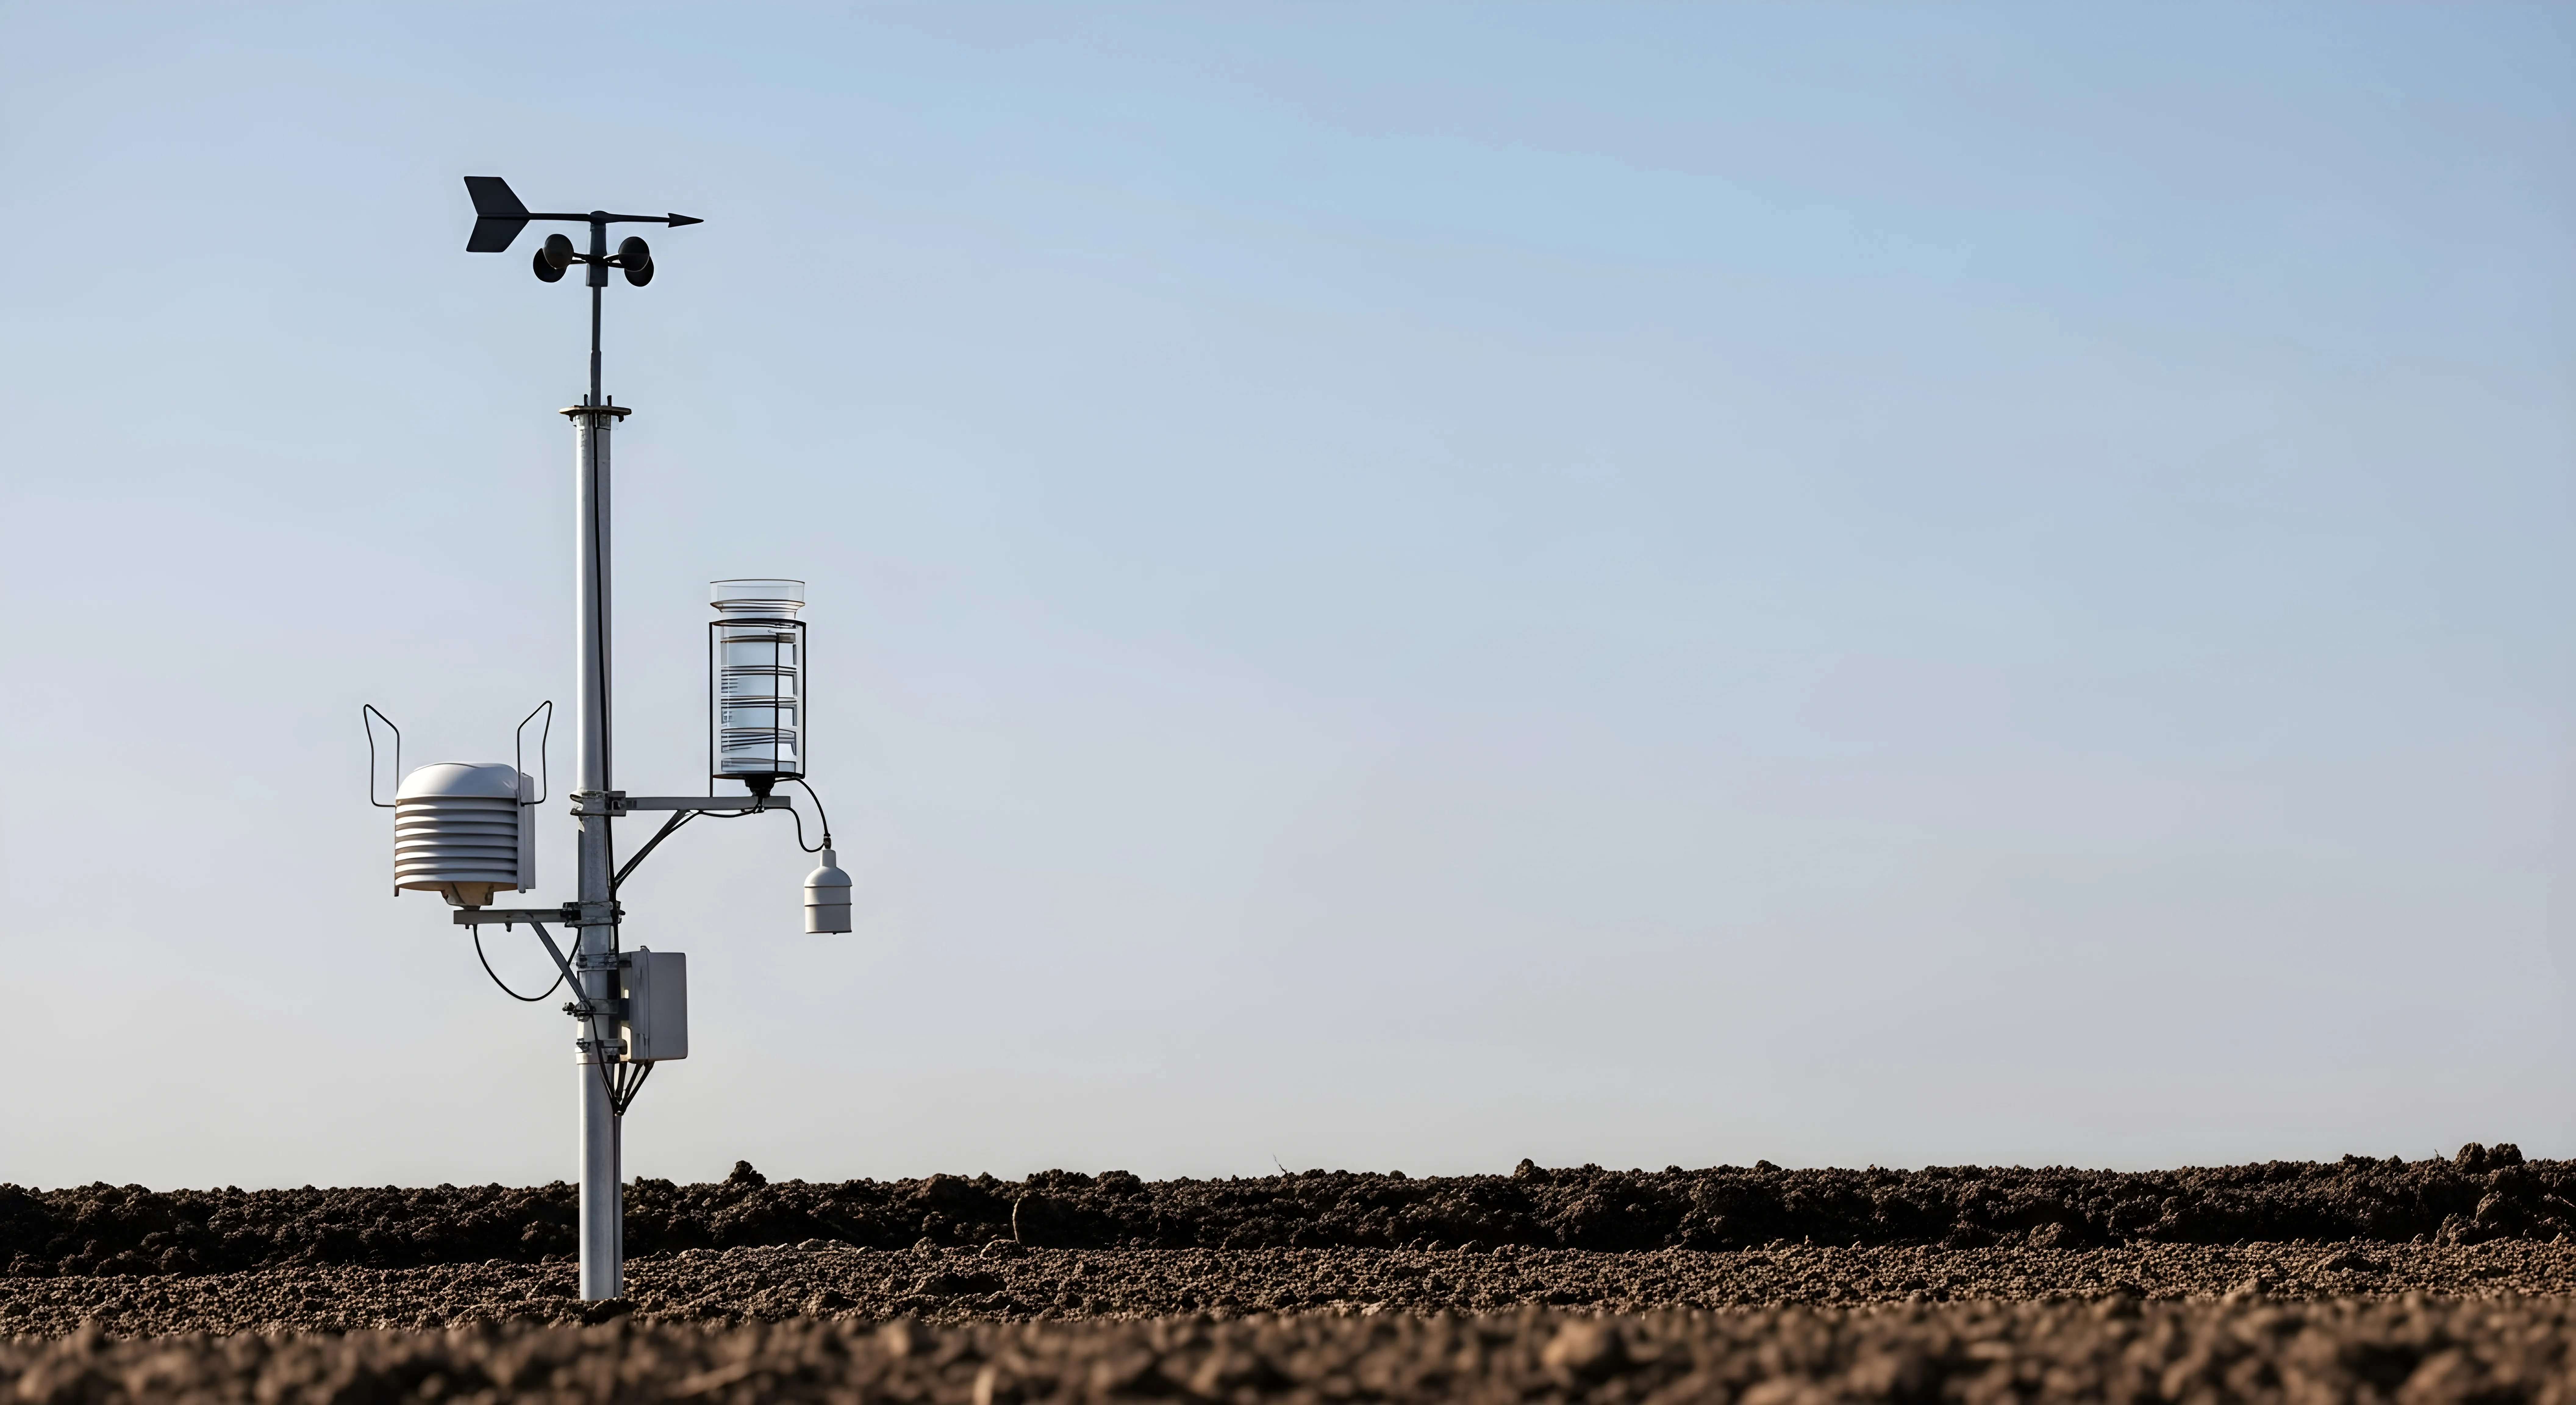
The station measures the real conditions of the operation site, not those of a distant station.
Multi-sensor
Local data
The field
Coverage wherever it's needed
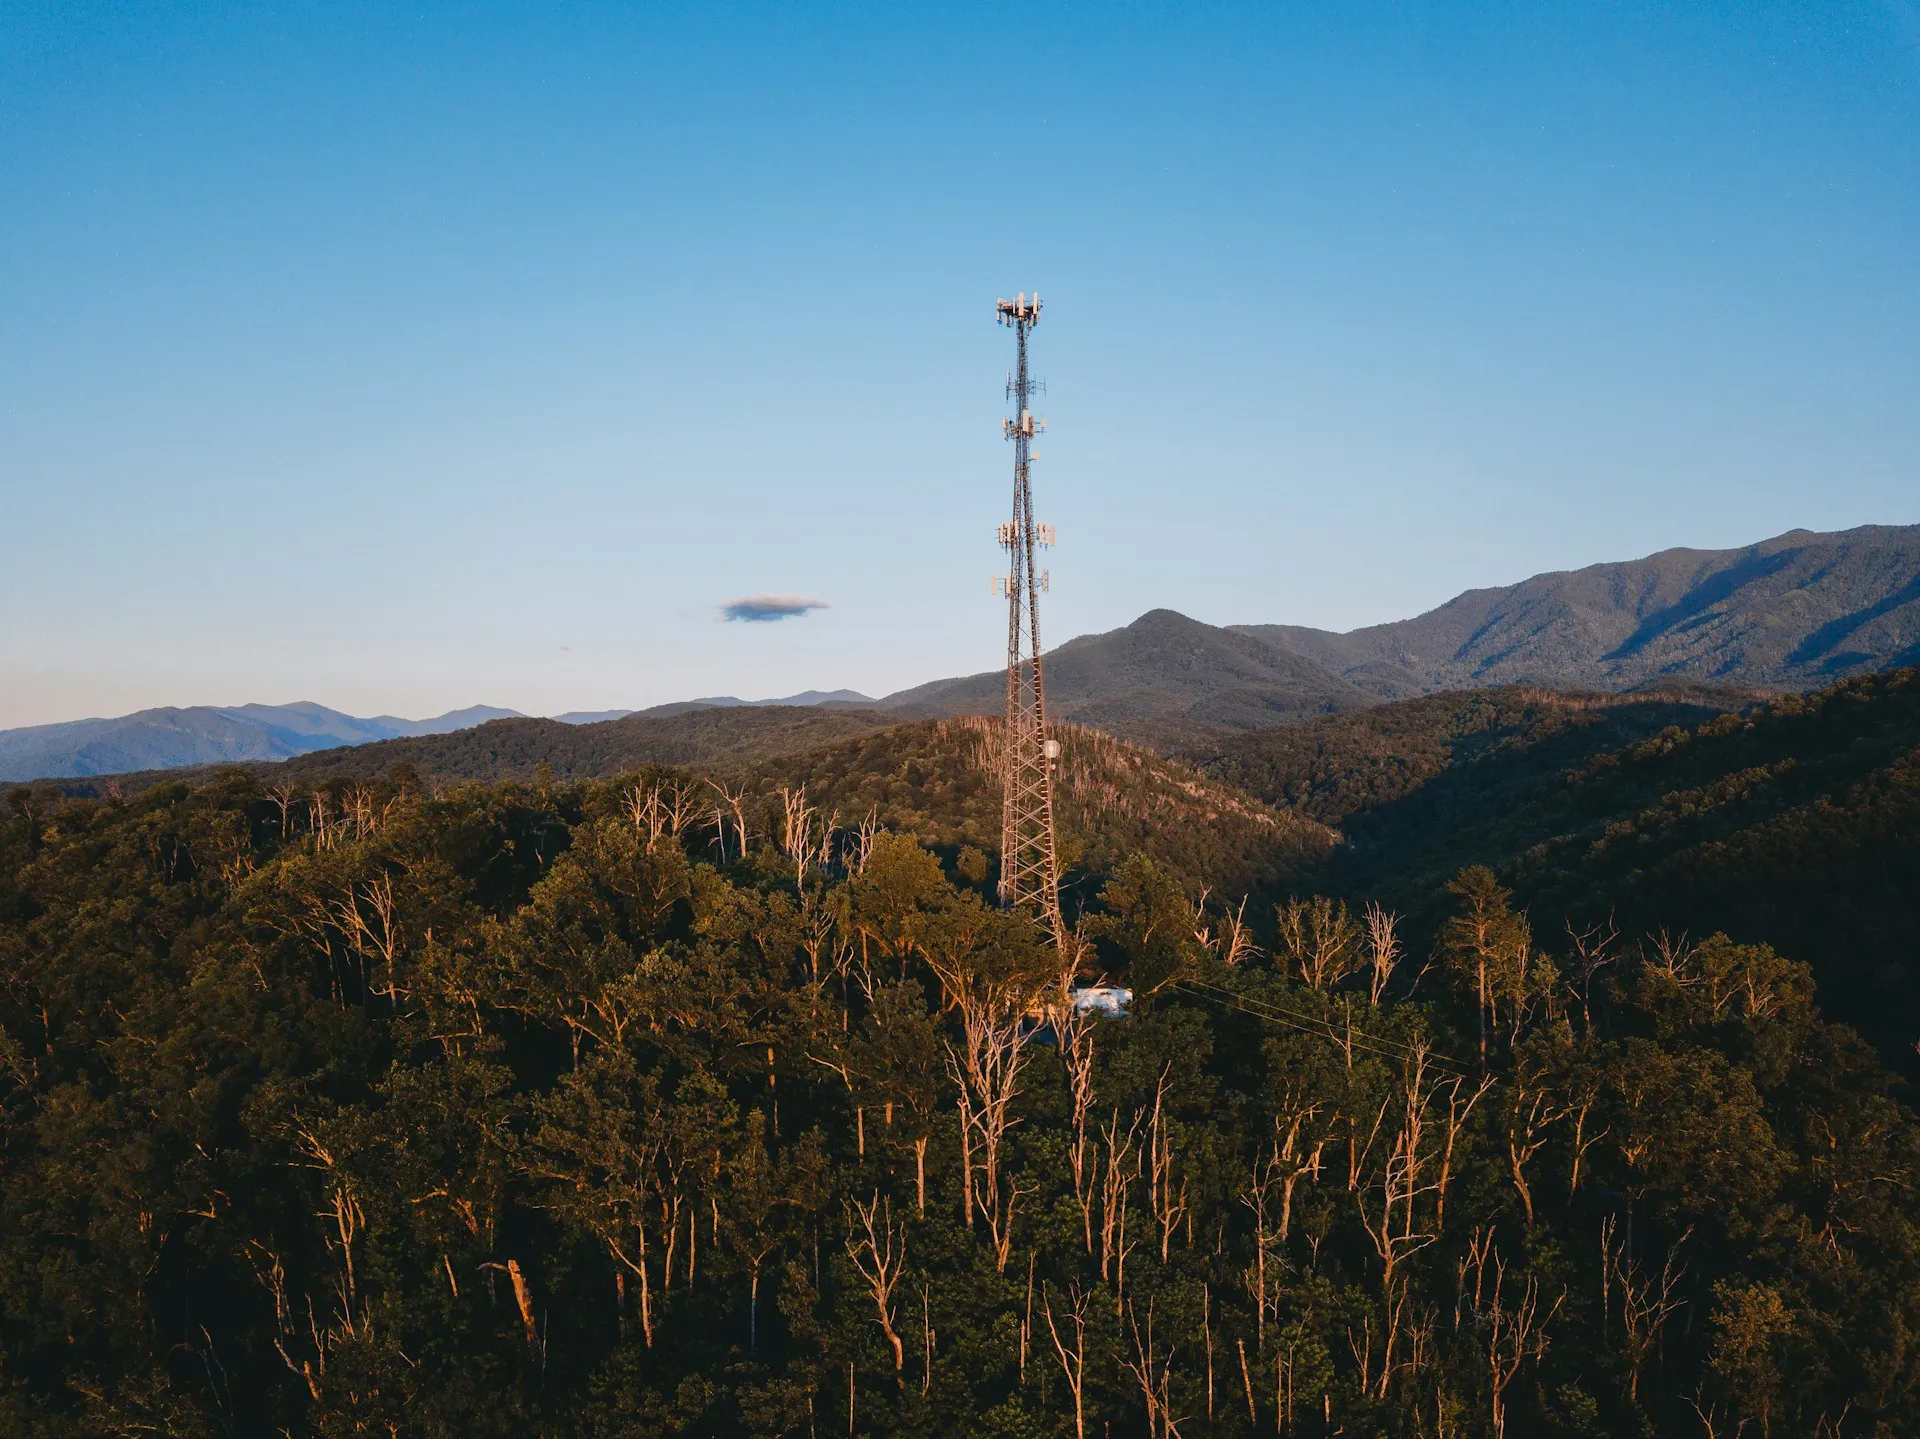
LoRaWAN, LTE/5G, Wi-Fi, Ethernet or satellite, combined depending on the site. Forests, mines, farms and job sites start sending continuous data even without conventional coverage.
LoRaWAN
LTE/5G
Satellite
Scale
From one station to a whole region
Scale by station, area, farm, plant or region and keep a consolidated view of geographically distributed environments, comparing units side by side.
Multi-station
Consolidated view
How it works
A weather station right at the operation site
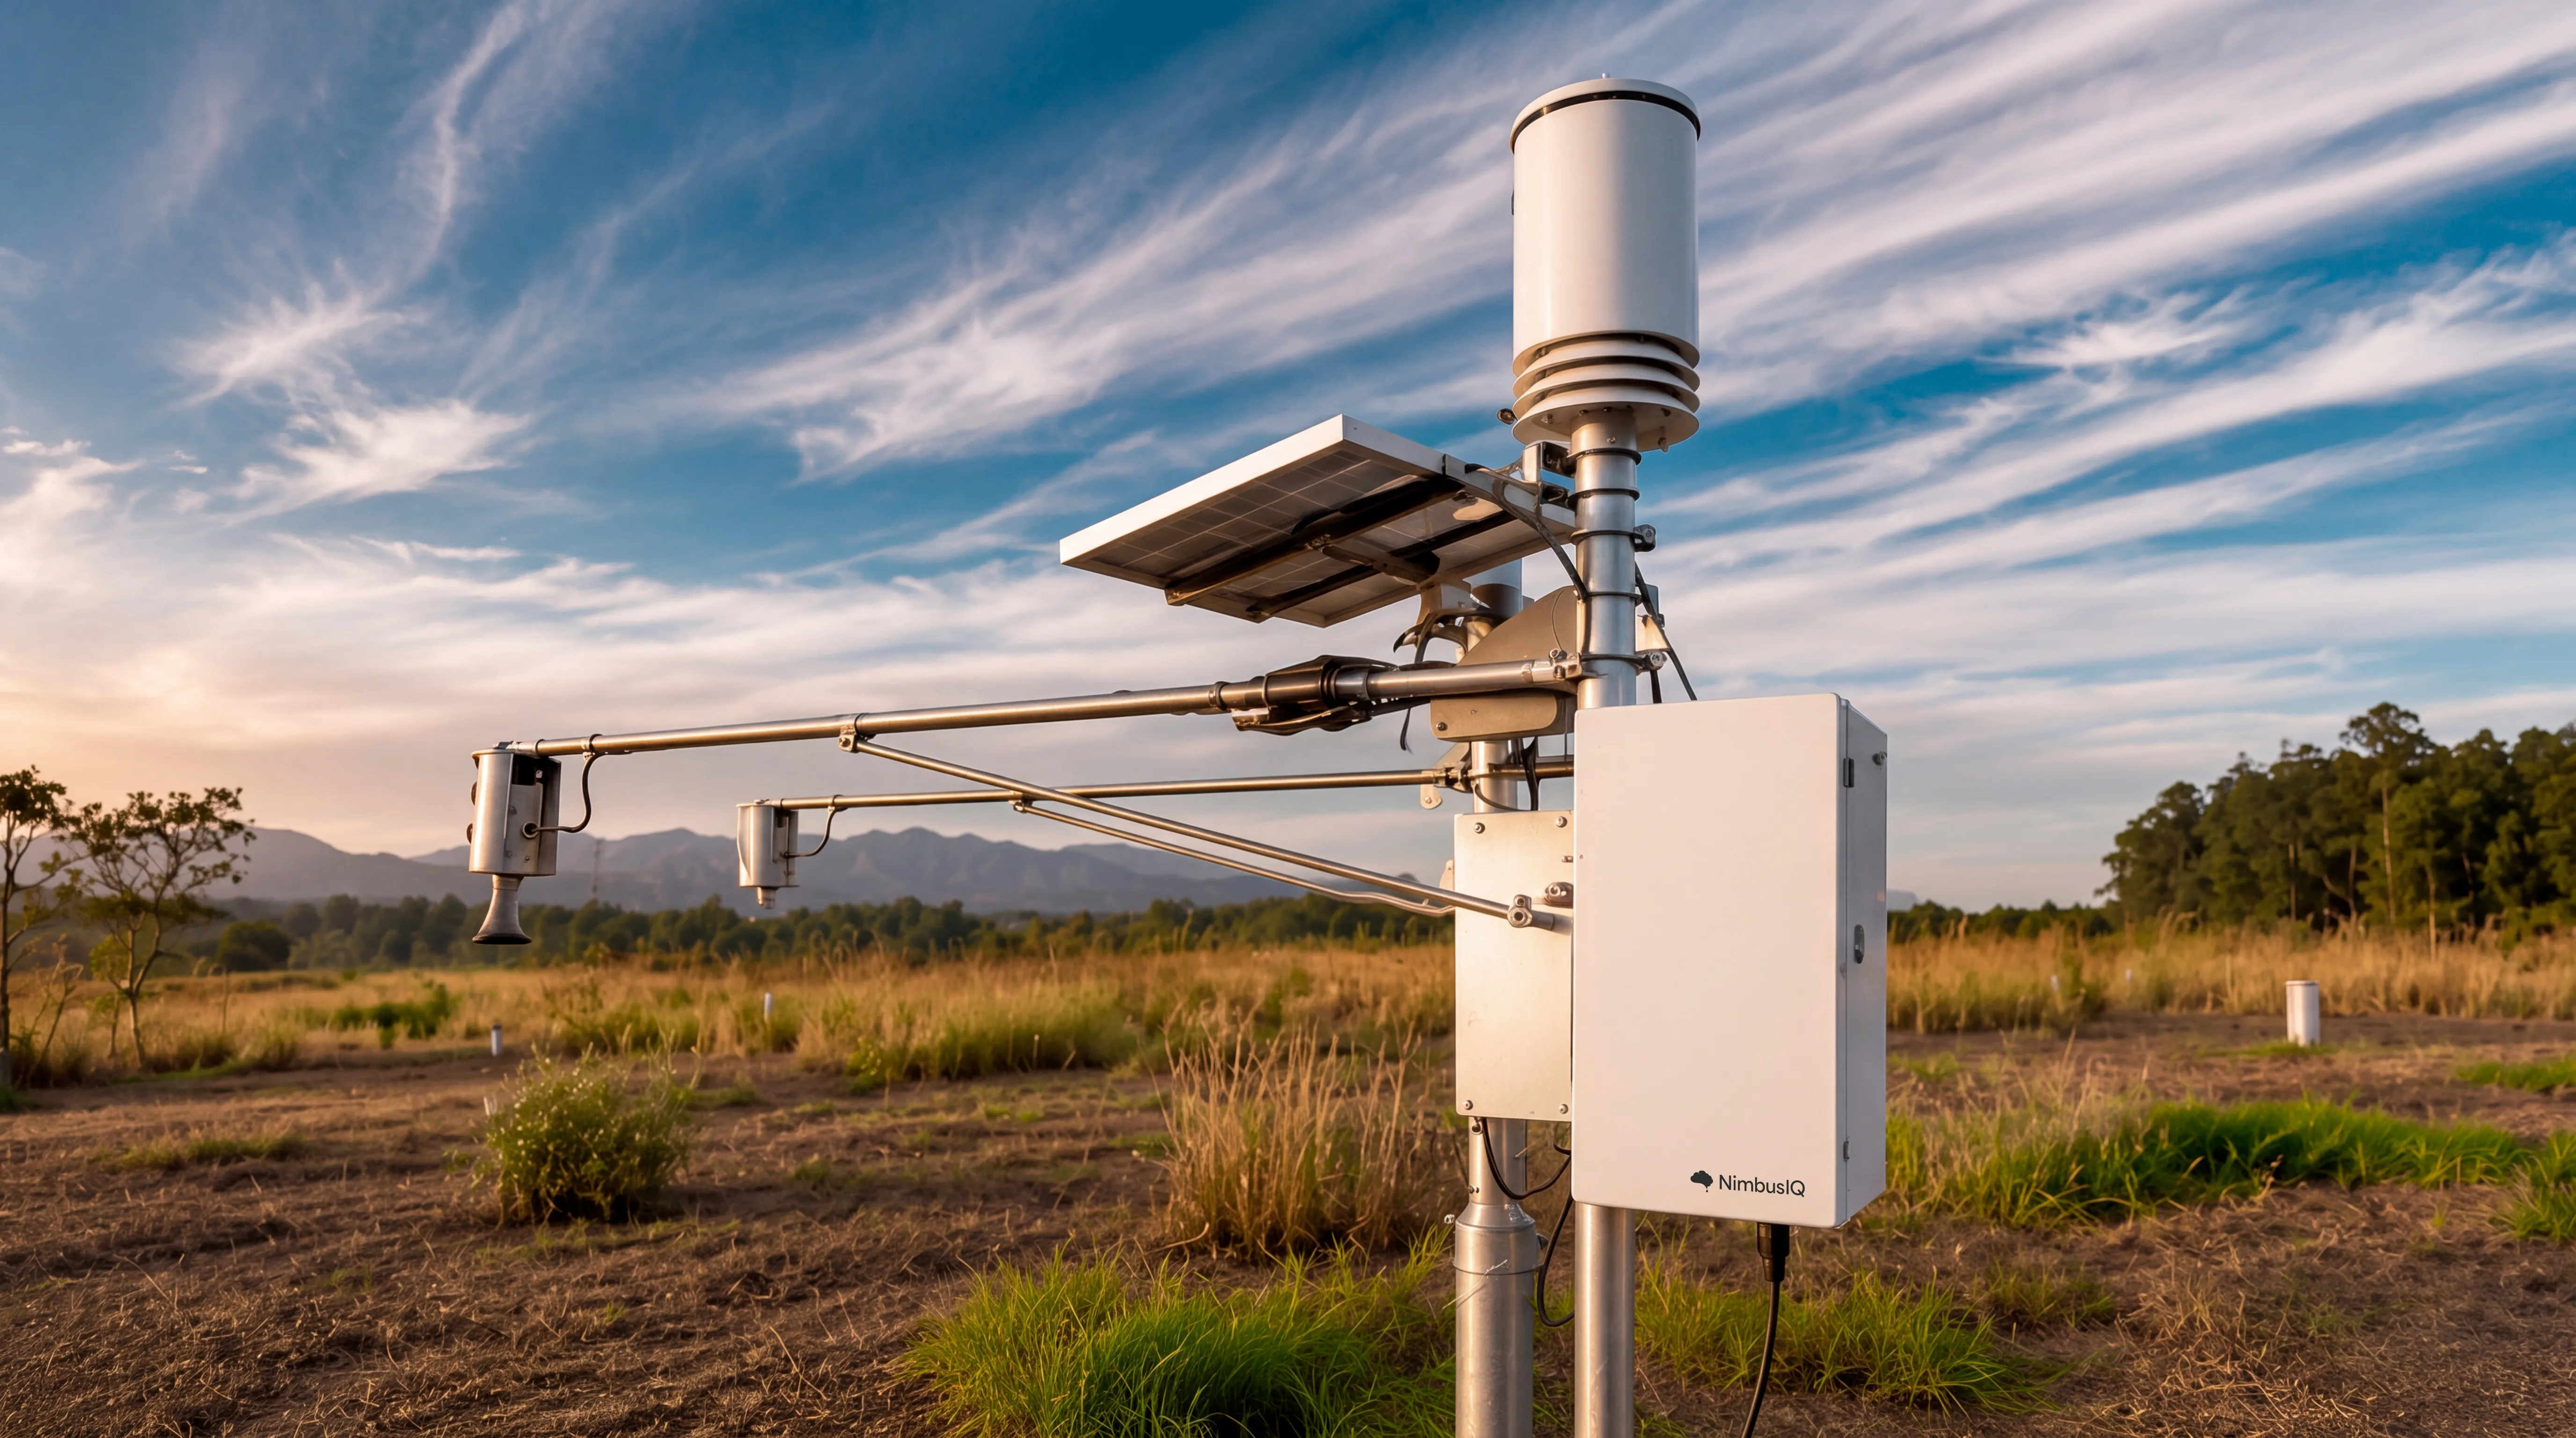
A multi-sensor station installed exactly where climate affects your results, connected through whatever medium exists on site. Every measurement becomes an operational reading, a comparable history and an automatic alert inside the systems your operation already uses.
Multi-sensor
Real time
Remote
Integrated
Measures the variables that affect your operation
Temperature, air humidity, precipitation and atmospheric pressure. Wind speed and direction, solar radiation and soil moisture. Other environmental sensors can be integrated depending on the application.
Connects through whatever medium exists on site
LoRaWAN, LTE/5G, Wi-Fi, Ethernet or satellite, combined depending on the installation point. This enables stations in urban, industrial, agricultural or remote areas, even without conventional coverage.
Turns measurement into an operational reading
Dashboards, maps, history and real-time indicators. The history is available to compare stations, periods, areas and operating units and to analyze how the environment behaves.
Warns and talks to your systems
Alert rules fire when parameters reach the limits you defined. The data integrates with IoT, SCADA and control centers, and with SYSGuard to support wildfire risk assessment.
Demo
The whole operation on one screen.
Measurements, history, alerts and predictions from your operation site. Hover over each feature to see where it lives on the dashboard.
FAQ
Frequently Asked Questions
Everything you need to know before bringing connected weather stations to your operation.
What is NimbusIQ?
It's a connected weather station solution that turns local environmental measurements into continuous operational information. Climate is measured right where the decision happens, not at a distant station, and reaches the operation as a dashboard, history and alerts.
Why measure climate at the operation site?
Weather-exposed operations can't rely only on generic information or distant stations. Without local data, history and alerts, decisions about safety, production, travel and fire prevention become reactive. With a station at the operation site:
The measured conditions are the real ones for the site, not a regional estimate
History lets you compare periods and analyze how the environment behaves
Alerts fire when parameters reach the limits you defined
Safety, planning and mobilization decisions become proactive
What variables does the station measure?
The base configuration covers the variables that most affect risk and performance, and other environmental sensors can be integrated depending on the application:
Air temperature and humidity
Precipitation and atmospheric pressure
Wind speed and direction
Solar radiation and soil moisture
How does the station connect?
Connectivity is chosen based on the site, and different media can be combined in the same operation: LoRaWAN, LTE/5G, Wi-Fi, Ethernet or satellite. That's what lets you install stations in urban, industrial, agricultural or remote areas without depending on a single infrastructure.
Where can NimbusIQ be installed?
In urban, industrial, agricultural or remote areas. The solution scales by station, area, farm, plant or region, and keeps a consolidated view of geographically distributed environments.
What can you track on the platform?
The platform brings together each station's readings and the comparison between them:
Dashboards, maps, history and indicators
Comparison between stations, periods, areas and operating units
Automatic alerts and a log of each one
Status of connected devices and incoming measurements
How do alerts work?
You define alert rules for the environmental conditions that matter to your operation. When a parameter reaches the defined limit, the alert fires and is logged in the history, supporting safety, planning and team mobilization decisions.
Does NimbusIQ integrate with the systems I already use?
Yes. Weather data is integrated with the systems your operation already uses, including:
IoT and SCADA
Control centers
SYSGuard, to support wildfire risk assessment
Which industries is NimbusIQ built for?
For operations where wind, rain, temperature or humidity affect risk and performance:
Agribusiness and forestry
Mining and industry
Energy and highways
Construction and logistics
Civil defense
Environmental monitoring
How are security and governance guaranteed?
The operation keeps control over devices, access and the trail of what was measured:
Identification and management of connected devices
Access control by role, station, area and customer
Protection of communication according to the connectivity medium used
Logging of failures, outages and relevant changes
Traceable history of measurements and alerts generated
Get in touch
Precise weather intelligence for your operation
Tell us where your operation is located and which climate risk concerns you most. We'll be happy to put together material for you.